About

I am an assistant professor in the Computer Science Department of Reykjavik University in Iceland.
Previously I was an ELBE postdoctoral fellow at the Center for Systems Biology Dresden, a joint initiative of the Max Planck Institute for Cell Biology and Genetics and the Max Planck Institute for the Physics of Complex Systems.
Contact me at:
- e-mail:
szhorvatätgmail.com - phone: +354 825 6366
- snail mail: Dept. of Computer Science, Menntavegur 1, 102 Reykjavík, Iceland.
By popular demand, how to pronounce my name?
Research
The Book of Nature is written in the language of mathematics. – Galileo Galilei
I am interested in applying the philosophical approach and mathematical methods of physics—especially statistical mechanics—to understand complex systems, either man-made ones or those found in nature.
Ensembles of connected networks
Random graph models are among the fundamental tools of network science. Essentially, random graph models are probability distributions over the set of graphs. One way to define them is through constraints: restrict the set to those graphs which possess certain properties. Such constrained graph ensembles are especially useful as null models, i.e. to check if an interesting observed feature of a real-world network is the consequence of a more basic property. The basic property is encoded into a model as a constraint, then networks sampled from the model are examined to see if they also have the feature of interest.
Two of the most commonly needed constraints for practical network analysis are (1) prescribing the exact degrees of vertices (typically used as the null model for motif analysis, when finding rich-club structure, investigating degree correlations, etc.), and (2) enforcing the connectedness of the network. Many real-world networks in physics (e.g. molecules: networks of atoms), biology (e.g. vasculature, brain networks), engineering (e.g. power grid), and other fields are naturally connected. Connectedness is also assumed by several oft-employed network statistics (such as closeness or eigenvector centrality), or when studying processes on networks (such as epidemic spreading). Yet incorporating these constraints into random graph models is far from trivial. This is why ad-hoc attempts to do so are still commonplace in practical network analysis. For example, when a connected network is required, it is common to simply take the largest connected component and ignore the rest. Currently little is known about how this affects the properties of the graph ensemble.
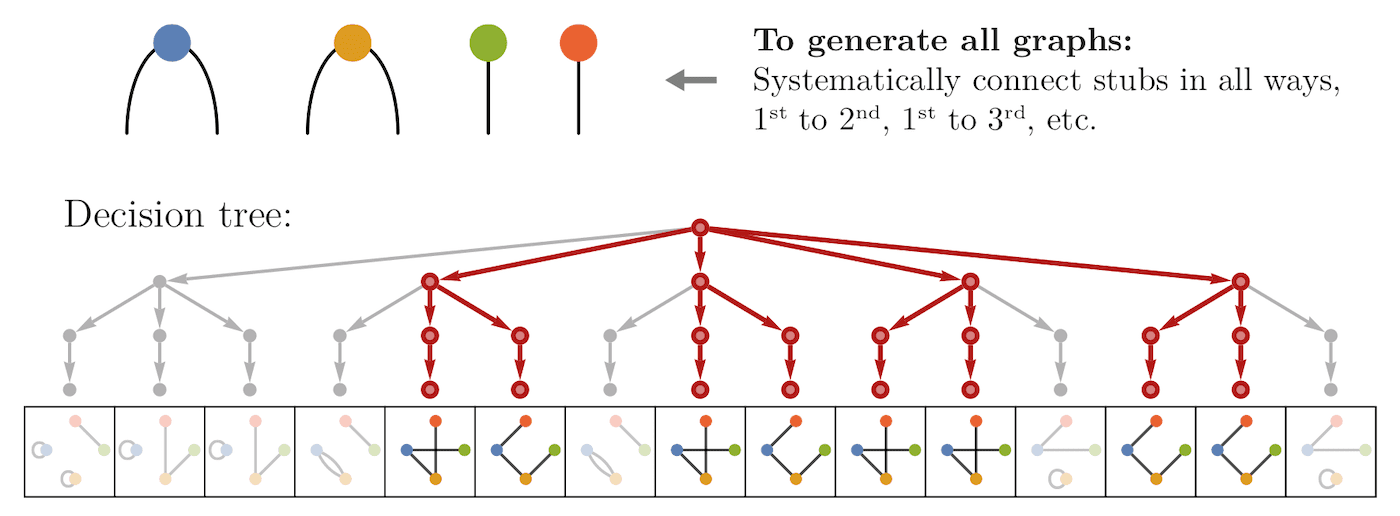
In this work, we describe a new method for the random sampling of connected graphs with a specified degree sequence. We consider both the case of simple graphs and that of loopless multigraphs. Using this method, we demonstrate that enforcing connectedness (as opposed to simply taking the giant component) may significantly alter the properties of the sampled graphs. Additionally, we present a novel and elegant algorithm to generate a single connected realization of a degree sequence.
- Connectedness matters: Construction and exact random sampling of connected networks (J. Phys. Complexity)
- Software for sampling connected graphs with given degrees
- To construct a single connected graph with given degrees, use
IGRealizeDegreeSequencefrom IGraph/M origraph_realize_degree_sequence()from C/igraph. - Press coverage: Phys.org | ScienceDaily | Originally from MPI-CBG
Networks of the brain
The lengths of individual axons (\(d\)) running between different functional areas of the cerebral cortex follow an exponential distribution: \(p(d) = \lambda e^{-\lambda d}\). This property is referred to as the Exponential Distance Rule (EDR). The EDR was originally shown using retrograde tracing experiments in the macaque monkey and later confirmed with higher accuracy in the mouse brain.
The EDR expresses the fact that there are many more short connections than long connections in the brain. The relationship between connectivity and distance was usually studied using a very direct approach where it is the probability or the strength of an interareal connection (made up of many axons) that is being measured. However, when looked at this way, the data is very noisy: for any given connection length, the observed connection strengths span several orders of magnitude. This makes it difficult to establish a simple mathematical relationship between strength and distance with any confidence. In contrast, the EDR refers to the distribution of individual axonal lengths, and expresses a relationship that can be verified to much higher accuracy.
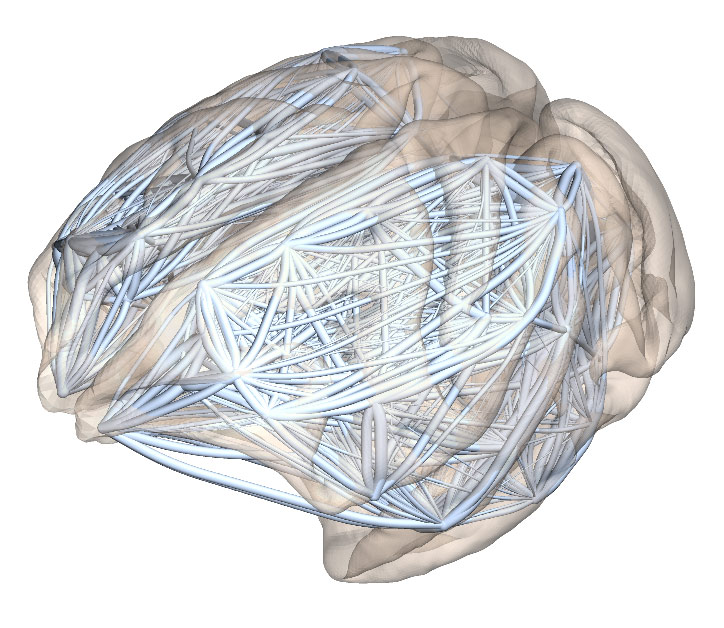
Using the EDR, we can also build a random graph model, which is able to reproduce many observed global network properties of brain networks ("connectomes"). Thus it serves as a starting point for analysing connectome structure.
While the EDR holds very well when including axonal lengths from throughout the cortex in the distribution, it is important to note that it is a global, average property. When looking at axons projecting into one specific area, we can observe consistent fluctuations around a perfect exponential decay. These are not random, but consistent across several individual brains, and may be related to the particular function of that area.
Using these observations we have compared the macaque and mouse connectomes using a common framework. The axonal length distribution has a steeper decay (relative to brain size) in the macaque brain than in the mouse. The larger macaque brain is also observed to have fewer long-range connections which are also weaker. This lends to the prediction that long connections may be even weaker in the still larger human brain, which could explain why humans are susceptible to certain mental illnesses such as schizophrenia and Alzheimer's disease.
- Architectural Invariants in the Cerebral Cortex (PLOS Biol.)
- Press coverage: Phys.org | ScienceDaily | MSN | IBTimes | MNT
- Commentary by B. Finlay (PLOS Biol.)
Sampling networks with constrains – Maximum Entropy models
While working on problems related to sampling random graphs (networks) with arbitrary constraints, we have developed a solution for the so-called degeneracy problem of Exponential Random Graph (ERG) models (see below), which greatly extends their practical applicability.
The simplest type of sampling constraint is a sharp constraint where the value of certain graph measures (quantities) is strictly prescribed: e.g. choose any graph that has precisely \(m\) edges with equal probability. There are no generally applicable methods for working with arbitrary sharp constraints.
An average constraint is more relaxed: sample from a graph distribution where only the average of certain graph measures is fixed. There are many distributions with the same mean, and the principle of maximum entropy (E.T. Jaynes, 1957) selects the one which contains the least bias other than the constraint. Applying average constraints to graphs distributions leads to ERG models.
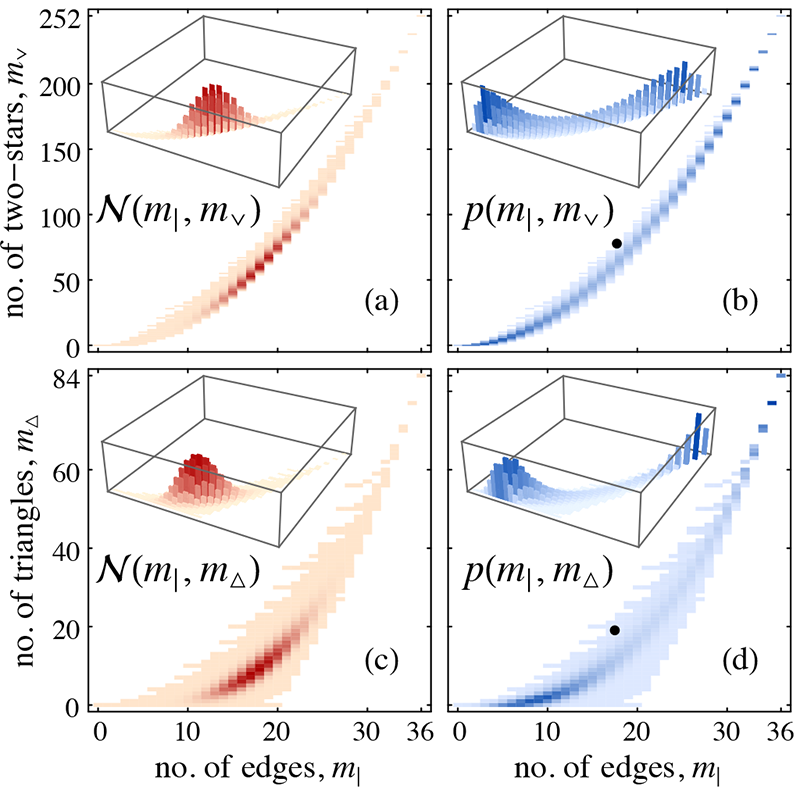
ERG models have become a popular network analysis tool, but unfortunately they may suffer (depending on the particular constraints) from a significant drawback termed degeneracy: e.g. when the edge count of a graph is constrained in average, the sampled graphs may all be either very sparse or very dense, but none represent the average edge count. This precludes most practical applications which assume a unimodal distribution concentrated around the average.
We have developed a practical solution for reducing degeneracy that relies on carefully chosen transformations of the constrained measures. Until now, the feasible choice of constraints for ERG models was limited because of the need to avoid degeneracy. Our work opens up the way to allowing the modelling problem at hand to dictate the choice of constraints, greatly expanding the practical applicability of ERG models.
Analysing a novel synchronization model
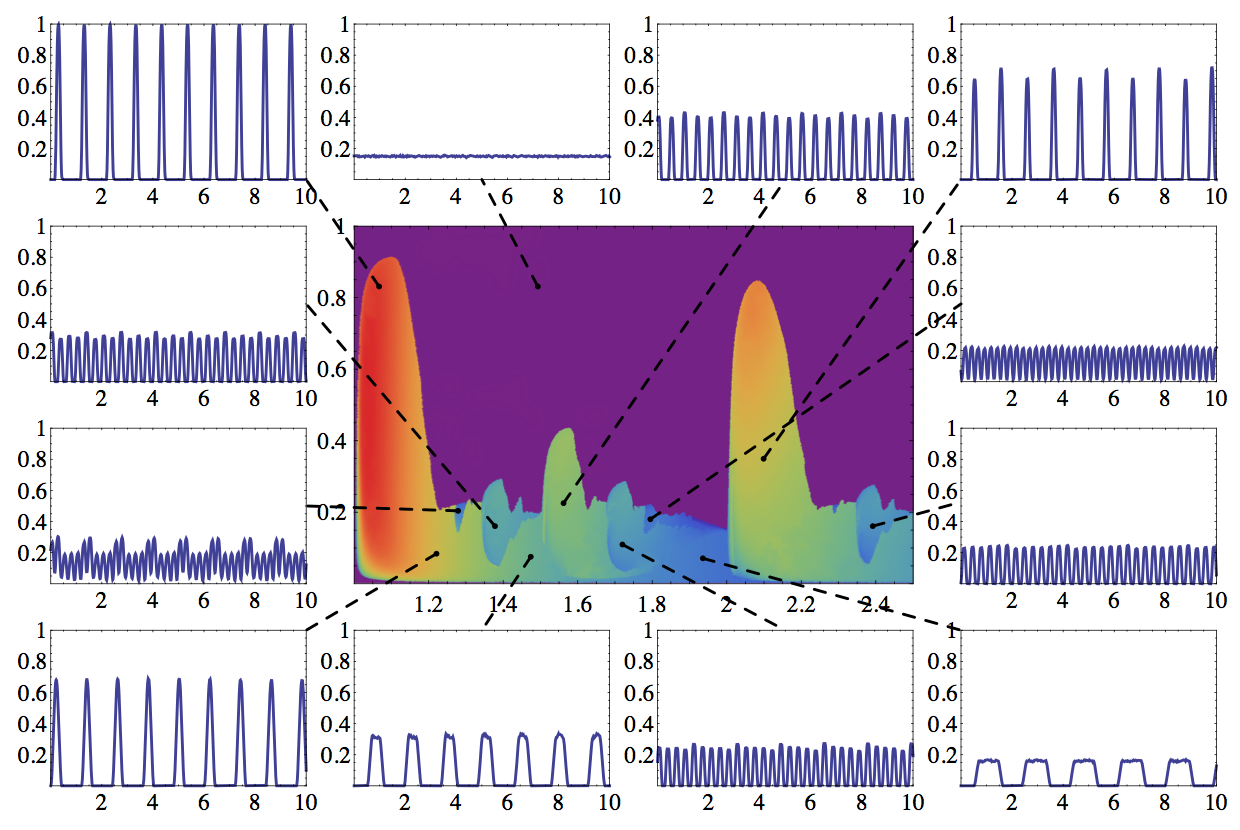
Spontaneous synchronization occurs in many places in nature (fireflies flashing together, rhythmic applause, mechanically coupled metronomes, etc.) and has been widely studied. Most synchronization models fall into two main categories: phase-coupled oscillators (e.g. the Kuramoto model) or pulse-coupled oscillators (e.g. integrate and fire model). An entirely different model (described by Nikitin et al., PRL 87, (2001)) uses oscillators that periodically output some signal: let's imagine flashing lights for an intuitive picture. The oscillators are bimodal, being able to flash either quickly or slowly. A surprising result is that if each individual unit switches between the fast and slow modes in an attempt to keep the momentary total light intensity in the system at a fixed level, their flashing may become synchronized. This model is remarkable because synchronization emerges as a non-obvious side effect of an interaction aimed at optimizing an entirely different property of the system. I worked with Prof. Zoltán Néda on understanding the behaviour and mapping the phase space of this model family.
- The complex parameter space of a two-mode oscillator model (Physica D)
- Unexpected synchronization (J. Phys. Conf. Series)
Curriculum Vitae
- Download as PDF (updated in 2024)
GPG Public Key
Links
- ORCID and arXiv
- GitHub and BitBucket
- Twitter: @szhorvat
- Mastodon: @szhorvat@fediscience.org
- Mathematica StackExchange and Wolfram Community